Why a Low CAC Can Be a Warning Sign (and How to Check It)
ClickTrust Research · · 10 min read · The Signal · CAC · invalid traffic · performance marketing · install fraud
TL;DR A falling customer acquisition cost is only an efficiency gain when activation, retention, refund rate and lead contact rate hold up with it. Because unprotected inventory carries roughly ten times the invalid-traffic rate of certified channels, a CAC that drops while those downstream metrics drop is a warning sign, not a win.

Key takeaways
- Imperva found that bots generated more than 53% of all web traffic in 2025 and that 40% of bot traffic was malicious, so the cheapest reach is bought from a pool that is more than half automated.
- TAG measured invalid traffic at 10.36% in unfiltered video and display channels against about 1% in TAG Certified Channels, so a budget shift toward unprotected inventory lowers unit cost while raising the invalid share roughly tenfold.
- AppsFlyer reports that affiliates run an install fraud rate of about 40% every quarter against about 1% for self-reporting networks, a 36x gap, and that Android install fraud reaches 59% for gambling apps and 31% for finance apps.
- Fake installs made up 87% of detected Android fraud and 92% of iOS fraud in AppsFlyer's data, so a cheap cost per install from a weak partner is mostly installs that never open again.
- ANA case studies show nearly 40% reductions in cost per conversion when advertisers optimize to quality-adjusted metrics, which is what a real efficiency gain looks like: cost falls because quality rose.
- A five-step check that compares CAC with activation, retention, refund rate and lead contact rate separates real efficiency from a low CAC warning sign without needing new tools.
Why does a falling CAC need a second look?
A falling customer acquisition cost is only good news when the customers behind it are real, and a low CAC warning sign is the case where they are not. Google defines invalid clicks as "clicks on your ads that don't represent a genuine interest in your business," and its help page notes that reports can in rare cases show more conversions than clicks, because a converting click was later marked invalid (Google Ads Help, Invalid clicks: Definition). Invalid clicks still land on your site, still create sessions, and in many accounts still fire conversion events. The cheaper the click, the more of that invalid share your CAC is built on.
A low CAC warning sign is a drop in customer acquisition cost that downstream metrics such as activation, retention, refund rate or lead contact rate do not confirm. When CAC falls and quality falls with it, the campaign has not become more efficient. It has started paying less for worse traffic.
This post is the companion to episode 1 of The Signal, the ClickTrust podcast, in which host Sheoli Biswas talks with Anvesha Poswalia about why a low CAC can be a warning sign. The argument below rests on published data rather than on the conversation, so every figure can be checked against its source.
What is a low CAC warning sign?
A low CAC warning sign is any CAC improvement that arrives without a matching improvement, or at least stability, in what the acquired users do next. A healthy efficiency gain shows up in the finance numbers: more activated accounts per dollar, steadier retention curves, fewer refunds, more leads who answer the phone. A fake one shows up only in the ad platform.
The distinction matters because paid channels report on their own success. Google Ads, Meta, TikTok and LinkedIn count the click or the conversion event, not the customer who pays an invoice three months later. If invalid traffic can trigger the event, the platform's CAC falls while the business's real CAC rises.
Why are cheap clicks so often invalid clicks?
Cheap inventory is cheap partly because less of it is filtered before billing. Imperva's Bad Bot Report 2026 found that bots generated more than 53% of all web traffic in 2025, humans only 47%, and that 40% of bot traffic was malicious (Imperva). A budget that buys reach at the lowest unit cost is drawing from a pool that is more than half automated before anyone screens it.
Protection, more than price, separates clean inventory from dirty. TAG's 2025 European Ad Fraud Savings Report estimated an invalid traffic rate of 10.36% in unfiltered video and display channels, against about 1% in TAG Certified Channels, and found that the 24% of European spend still flowing through unprotected channels sustained more than ten times the relative level of invalid-traffic losses (TAG). In the United States, TAG reported invalid traffic under 1% in Certified Channels for the fourth consecutive year, across 745 billion impressions (TAG).
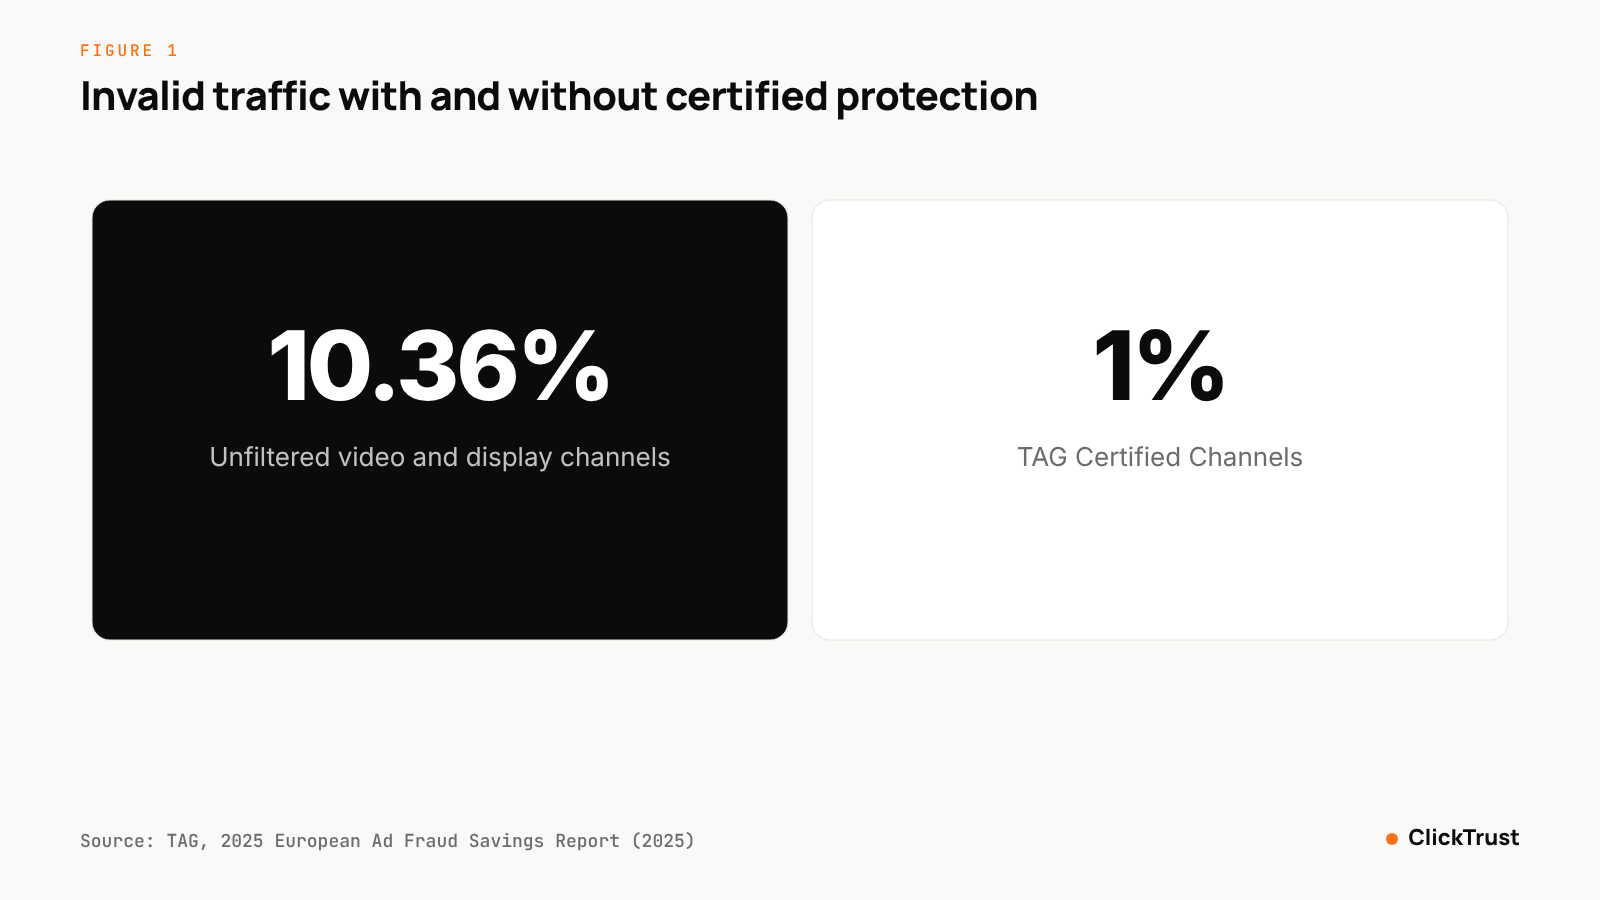 Figure 1. TAG's 2025 European Ad Fraud Savings Report put invalid traffic at 10.36% in unfiltered video and display channels against about 1% in TAG Certified Channels.
| Inventory | Invalid traffic rate | What it does to CAC |
|---|---|---|
| Unfiltered video and display channels (Europe, 2023 data) | 10.36% | Lower unit cost, about one in ten interactions invalid |
| TAG Certified Channels (Europe) | About 1% | Higher unit cost, almost every interaction real |
| TAG Certified Channels (United States, 745 billion impressions) | Under 1% | Same pattern, fourth consecutive year |
Source: TAG, 2025 European Ad Fraud Savings Report (2025) and TAG, US Ad Industry Extends Success in Fight Against Fraud (October 2024).
Real efficiency moves the other way. In the ANA's Q4 2025 Programmatic Transparency Benchmark, advertisers enforcing quality governance converted 56.7% of programmatic spend into benchmark-qualified impressions against 37.5% for lower performers, and ANA's case studies show nearly 40% reductions in cost per conversion when buyers optimize to quality-adjusted metrics (ANA). That is what a genuine CAC gain looks like: cost per conversion falls because quality went up, not in spite of it.
So the question to ask of any CAC drop is which direction quality moved. If the budget shifted toward Display, video partners, broad placements and automated campaign types, and nothing was done to filter them, the drop most likely came from the 10% side of TAG's gap.
How does install fraud make cheap installs look efficient?
App marketers see the same effect in cost per install. AppsFlyer's State of Fraud for Marketers 2026, drawn from more than 100 billion installs across 246,000 apps between Q1 2025 and Q1 2026, found that affiliates deliver about 40% of fraudulent installs at a fraud rate of roughly 40% every quarter, while self-reporting networks run at about 1%, a gap of 36x (AppsFlyer). A partner that delivers installs at a fraction of the cost of Google or Meta is often delivering a different product.
| Media source (Q1 2026) | Install fraud rate | Change over the year |
|---|---|---|
| Affiliates | About 40% | Stable, every quarter |
| Owned media | 11% | Up from 3.4%, a 221% rise |
| DSPs | 8.9% | Up from 5.6%, a 59% rise |
| Self-reporting networks | About 1% | Stable |
Source: AppsFlyer, The State of Fraud for Marketers 2026 (April 2026).
Fraud rates vary sharply by vertical. AppsFlyer reports Android install fraud at 7% for gaming, 10% for shopping and 31% for finance, while gambling apps on Android rose from 49% to 59% year on year and peaked at 64% in Q4 2025 (AppsFlyer). iOS fraud fell 33% year on year to 11.7% in Q1 2026, which is still a large share of a cheap install cohort (AppsFlyer).
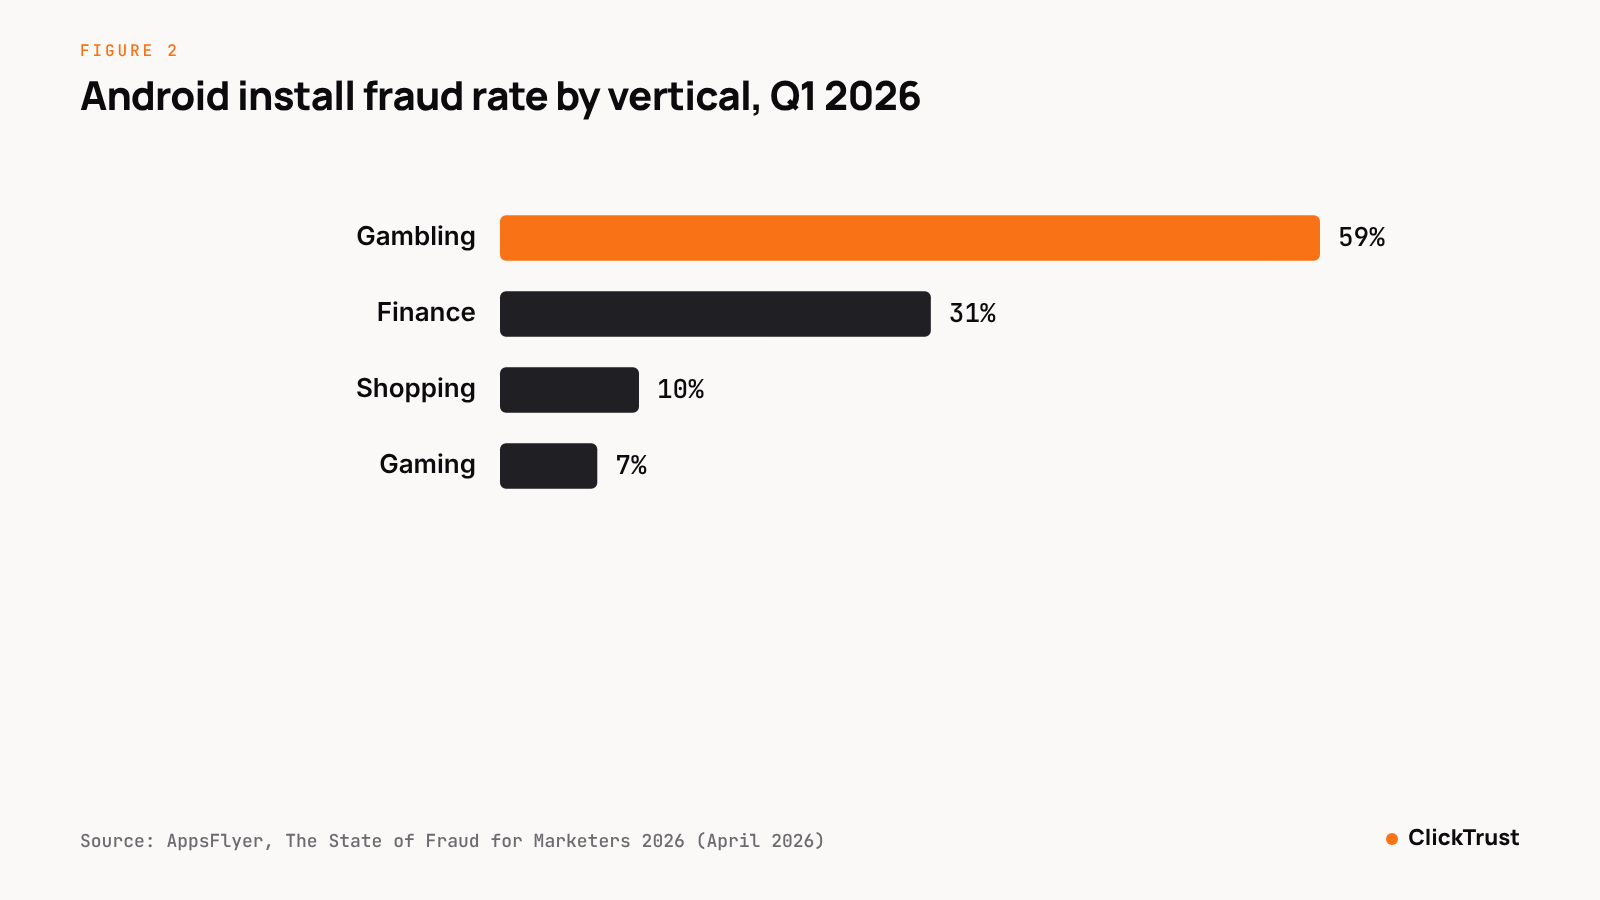 Figure 2. AppsFlyer's State of Fraud for Marketers 2026 puts Android install fraud at 59% for gambling and 31% for finance apps, against 7% for gaming.
Most of this fraud is not misattribution of real users. Fake installs made up 87% of detected Android fraud and 92% of iOS fraud, and physical device farms grew 72% year on year while emulator fraud fell 32%, which means cheap installs increasingly come from real handsets that pass basic device checks (AppsFlyer). A fake install never opens the app a second time, never completes onboarding and never pays. Its only contribution is to the denominator of your CPI.
Why is cost per lead the easiest metric to fake?
Lead generation is structurally exposed. An e-commerce conversion requires a payment, which bots rarely make. A lead conversion requires a form submission, which bots make easily and paid form-fillers make at scale. So cost per lead is the acquisition metric most likely to improve for the wrong reason.
The platforms acknowledge this. Google's Click Quality Form explicitly accepts investigation requests for "poor-quality form submissions" alongside invalid clicks (Google Ads Help), and Google says its protections cut advertiser exposure to invalid leads by an average of 30% so far in 2026 (Google). A 30% reduction is also a measure of how much invalid lead volume was reaching advertisers before it. Our guide to fake leads and lead-form spam covers the form-level defenses.
Why does CAC fall while quality falls?
Three mechanics push CAC down as traffic quality drops.
First, automated bidding learns from whatever conversion events it is given. If invalid clicks fire the event, the algorithm finds more of them, because they are cheap and plentiful. Second, budget reallocation rewards the cheapest conversion, and the cheapest conversions sit in the noisiest inventory. Third, platform refunds cover only what the platform detects. Google says you are not charged for invalid traffic detected before billing, credits post-billing detections on a later invoice, and now shows both amounts as "Estimated savings" and "Credited cost" in an Invalid traffic card (Google Ads Help). Everything the filter misses stays in your CAC as a conversion that will never activate.
TAG's data shows how large that remainder can be: about 1% in channels where every party is certified against fraud, and 10.36% where protection is absent (TAG). An unprotected account reporting a falling CAC may simply be reporting the 10.36% side of that gap.
A 5-step diagnostic: CAC against downstream metrics
Run this before celebrating any CAC drop. Each step compares the platform's number with a number the platform cannot see.
- Split CAC by channel, campaign type and placement. A blended CAC hides the shift. Rebuild it for Search, Performance Max, Display, video partners, each paid social platform and each affiliate or install partner. If the overall drop comes from the least filtered segments, treat it as a warning sign rather than a win.
- Compare CAC with activation rate. Define activation as the first action a real customer takes after conversion: verifying an email, completing onboarding, making a first deposit, attending a demo. Plot activation rate by segment over the same period CAC fell. A segment whose CAC fell while activation also fell bought traffic, not customers.
- Check retention cohorts. Group acquired users by the week they converted and track day 7, day 30 and day 90 retention per segment. Invalid traffic produces flat cohorts that vanish after the first session. Real efficiency gains leave retention curves unchanged or better.
- Reconcile refund and chargeback rates. Pull refunds, cancellations and chargebacks by acquisition segment from your billing or payment system. Rising refunds alongside falling CAC point to incentivized, mismatched or fraudulent conversions rather than demand.
- Measure lead contact rate. For lead generation, count the share of leads your team actually reached: valid phone number, answered call, replied email, booked meeting. A falling cost per lead with a falling contact rate is the clearest low CAC warning sign there is, and the one finance will notice first.
Record the result as a two-column comparison: the metrics that fell with CAC, and the metrics that should have held. If the second column moved in the wrong direction, pause the budget shift before the bidding algorithm compounds it.
What to do when the diagnostic fails
Start with the segments that failed, not the whole account. Exclude the worst Display and video-partner placements, tighten geography and device targeting, and move conversion goals from form fill to a downstream event such as a qualified lead or an activated account, so bidding learns from real outcomes. Pull the click data and file a claim where the evidence is strong; Google reviews requests covering activity within the last 60 days through its Click Quality Form (Google Ads Help).
For install campaigns, score partners on post-install behavior rather than CPI and hold payouts on the worst ones until they can explain the gap. For lead generation, feed contact-rate data back into the ad platform as the optimization signal. Then re-run the five steps every month. A low CAC that holds up across activation, retention, refunds and contact rate is one you can scale with confidence.
How ClickTrust helps
ClickTrust scores every click and install in under 50 milliseconds with a single Traffic Quality Index, using 320 detection traps labeled GIVT or SIVT in line with MRC invalid-traffic guidance. Web Protection pushes IP and audience exclusions to Google Ads, Meta and Bing automatically, and In-App Protection catches emulators, click injection and install hijacking before they inflate CPI. Typical ClickTrust audits find 14 to 42 percent of paid traffic is invalid depending on channel. For a first read before you run the diagnostic, Traffic Rx is a free landing-page traffic diagnosis, and ClickTrust is free to start.
Sources
- Google, Invalid clicks: Definition – Google Ads Help (fetched November 2026), https://support.google.com/google-ads/answer/42995
- Imperva, Bad Bot Report 2026: The Internet Is No Longer Human and It's Changing How Business Works (April 2026), https://www.imperva.com/blog/bad-bot-report-2026-bots-agentic-age/
- TAG, 2025 European Ad Fraud Savings Report (2025), https://ppc.land/content/files/2025/06/2025_TAG_EuropeanFraudSavingsReport-Final-compressed.pdf
- TAG, US Ad Industry Extends Success in Fight Against Fraud with Fourth Straight Year of Sub-1% IVT in TAG Certified Channels (October 2024), https://www.tagtoday.net/pressreleases/us-ad-industry-extends-success-in-fight-against-fraud-with-fourth-straight-year-of-sub-1-ivt-in-tag-certified-channels
- ANA, ANA Q4 2025 Programmatic Transparency Benchmark Shows Media Quality Is Now Driving Measurable Performance Outcomes (February 2026), https://www.ana.net/content/show/id/pr-2026-02-programatic
- AppsFlyer, The State of Fraud for Marketers – 2026 Edition (April 2026), https://www.appsflyer.com/resources/reports/state-fraud-marketers-report/
- Google, About the Invalid Activity Credit Report – Google Ads Help (2026), https://support.google.com/google-ads/answer/16826168?hl=en
- Google, We're introducing a new transparency tool for invalid traffic in Google Ads (November 12, 2026), https://blog.google/products/ads-commerce/invalid-traffic-overview-google-ads/
- Google, About invalid traffic – Google Ads Help (fetched November 2026), https://support.google.com/google-ads/answer/11182074?hl=en
Frequently asked questions
Why is a low CAC sometimes a bad sign?
Ad platforms calculate CAC from clicks and conversion events, not from paying customers. Bots and click farms can trigger both, and they concentrate in the cheapest, least filtered inventory. When a budget shifts toward that inventory, the platform's CAC falls while activation, retention and lead contact rate fall with it. The company is paying less per conversion but more per real customer.
Which channels carry the most invalid traffic?
The least protected ones. TAG's 2025 European Ad Fraud Savings Report put invalid traffic at 10.36% in unfiltered video and display channels against about 1% in TAG Certified Channels. On mobile, AppsFlyer's State of Fraud for Marketers 2026 found affiliates running an install fraud rate of about 40% against about 1% for self-reporting networks, and organic accounting for 52% of all fraudulent installs.
How do I know if a cheap cost per install is fake?
Compare each install partner on post-install behavior: day 7 and day 30 retention, onboarding completion, first purchase or deposit. AppsFlyer's 2026 report found the fraud gap between affiliates and self-reporting networks reached 36x, and that fake installs made up 87% of detected Android fraud and 92% of iOS fraud. A partner whose installs never return is selling installs, not users.
What downstream metrics should I compare CAC against?
Four cover most businesses: activation rate (the first real action after conversion), retention by weekly cohort, refund or chargeback rate from the billing system, and for lead generation the lead contact rate, meaning the share of leads your team actually reached. All four live outside the ad platform, which is why they catch what the platform's CAC misses.
Does Google refund invalid clicks automatically?
Google says you are not charged for invalid traffic detected before billing, that post-billing detections are credited on a later invoice, and that both amounts now appear as Estimated savings and Credited cost in an Invalid traffic card. Advertisers can request a review of the last 60 days through the Click Quality Form, which also covers poor-quality form submissions. The gap is in what the filters miss.